In Search of Temperature Minimum at Radio Wavelengths
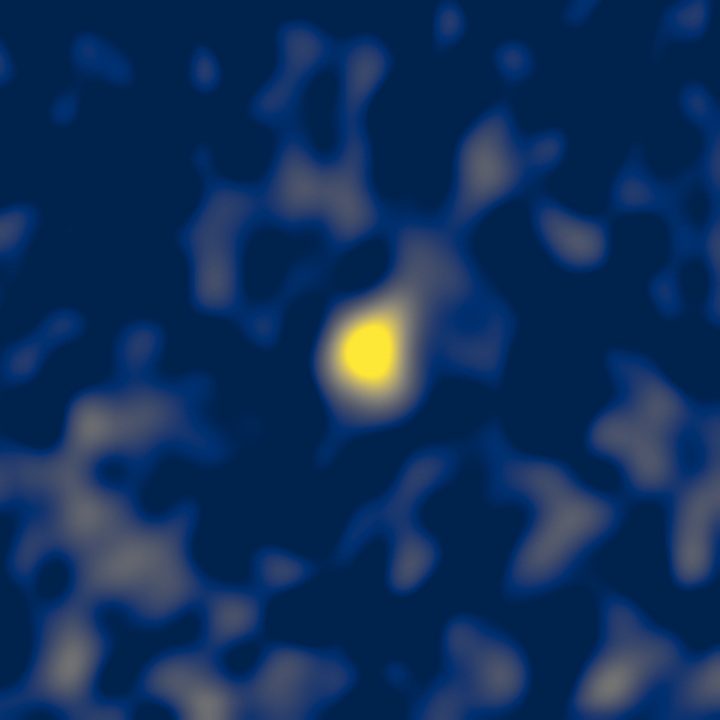 “Image” of Altair at 33 GHz taken with VLA interferometer. (White et al., 2021)
Introduction
Our ability to infer the physical characteristics of stellar atmospheres largely depends on our understanding of the emissions from stars at sub-millimeter to centimeter wavelengths. Unfortunately, the technical difficulty in observing main sequence stars at these wavelengths has delayed research in this area. However, with the development of new infrastructures such as VLA and ALMA, we have been able to explore stars other than our sun for the first time (Liseau et al. 2013, 2015, 2016 1 2 3). This has allowed us to develop a methodology to estimate the temperature structure in the upper atmosphere (Tapia-Vázquez & De la Luz, 2020 4). As a result, we have been able to establish that in solar-type stars the primary structure is similar, that is to say, the atmosphere is made up of five layers:
- Phostosphere
- Temperature Minimum Region
- Chromosphere
- Transition Region
- Corona
Photosphere
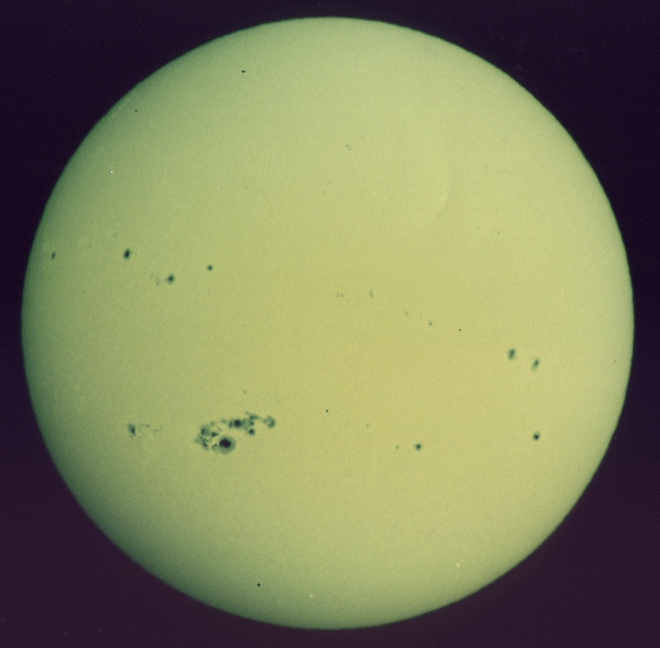
The photosphere can be defined as that portion of the stellar atmosphere visible in optical light where the continuum is optically thick, or nearly so, and where the temperature decreases as height increase because non-radiative heat sources are not strong enough to significantly modify the balance of radiative and convective energy input against radiative losses to space. This layer is studied with visible and infrared light.
Chromosphere
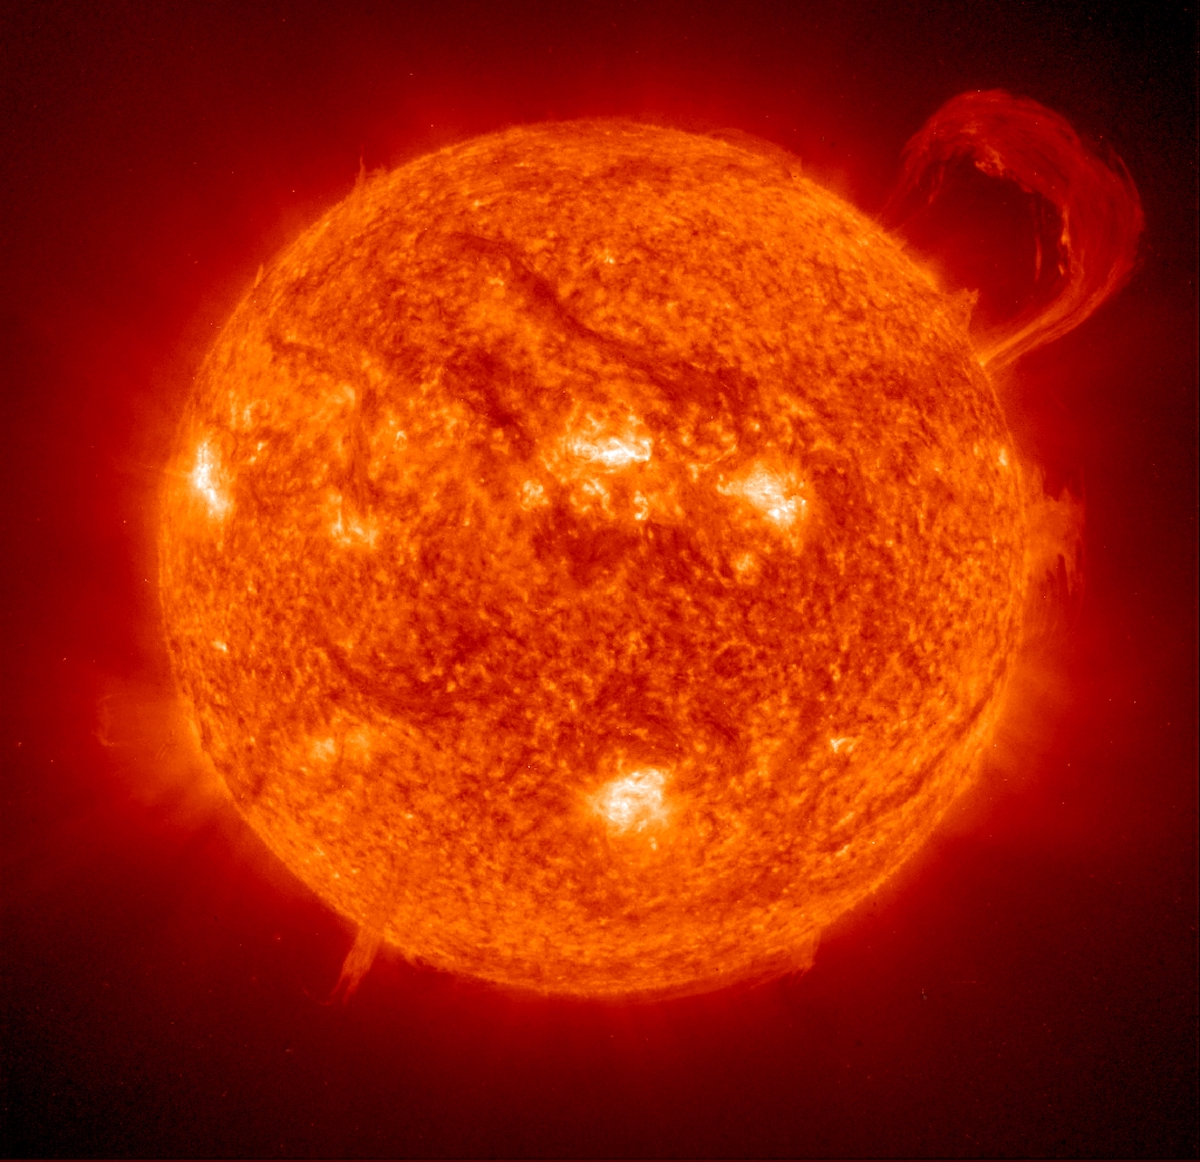
The chromosphere is an atmospheric region that begins at an atmospheric layer where there is a measurable amount of local heating in addition to radiative and convective heat transport from below (Linsky, 2017 5). This layer has been studied mainly in the EUV and UV. However, due to its physical nature, it is possible to study it at wavelengths ranging from the far infrared to millimeters.
Transition Region
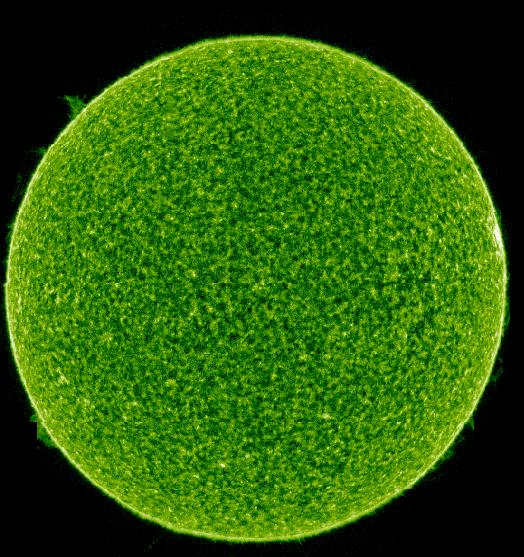
The transition region is the atmospheric layer where we can observe a sudden increase in temperature within a few kilometers. Study of this region is mainly focused on the EUV using space probes such as SOHO.
Corona
The extended outer atmosphere of the Sun is called the corona. It has a temperature of millions of degrees and is where the solar wind originates. This atmospheric layer is mainly studied using x-rays and radio frequencies below 1 GHz.

What about the Temperature Minimum Region?
At a certain height in the atmosphere, the temperature starts to increase as altitude increases due to a combination of reduced radiative cooling and nonradiative heating as the density decreases. This marks the lower boundary of the chromosphere, which begins at the minimum temperature ($T_{min}$) located at the top of the photosphere and extends upward as temperature increases. The upper photosphere has relatively high densities, resulting in efficient radiative cooling, whereas the nonradiative heating rate in the lower-density layers of the chromosphere is significantly greater. In this context we can say that the minimum temperature region is the layer where the temperature drops to its lowest point. It occurs approximately 500 km (310 miles) above the photosphere. The temperature in this region decreases in the case of the sun from about 5,500 K in the photosphere to around 3,800 K 5. This minimum temperature has been observed since the 1950s using observations of the sun at wavelengths between the far infrared and submillimeter. Due to the limitations of the instruments, it was not possible to carry out a census of solar-type stars. It was not until 2013 that Liseau et al. (2013) 1, using the Herschel space telescope, was able to measure the minimum temperature in a star other than the Sun for the first time. Subsequently, White et al. 2020 6 discovered a minimum temperature in an F-type star. More recently, White et al. 2021 7 found that A-type stars like Altair can also find the temperature minimum but at millimeter wavelengths.
How can we say that we see the minimum of temperature?
In order to say that we are observing the minimum temperature, we must make observations of the star’s atmosphere at different wavelengths. This does allow us to create an SED and analyze its behavior. In figure 5 we can see that by using various facilities we can reconstruct the emission of Altair’s atmosphere. We can see that at around 1.1 mm a minimum temperature is reached and at longer wavelengths it begins to increase. We can then say that we have found the minimum temperature.

Why is the minimum temperature important?
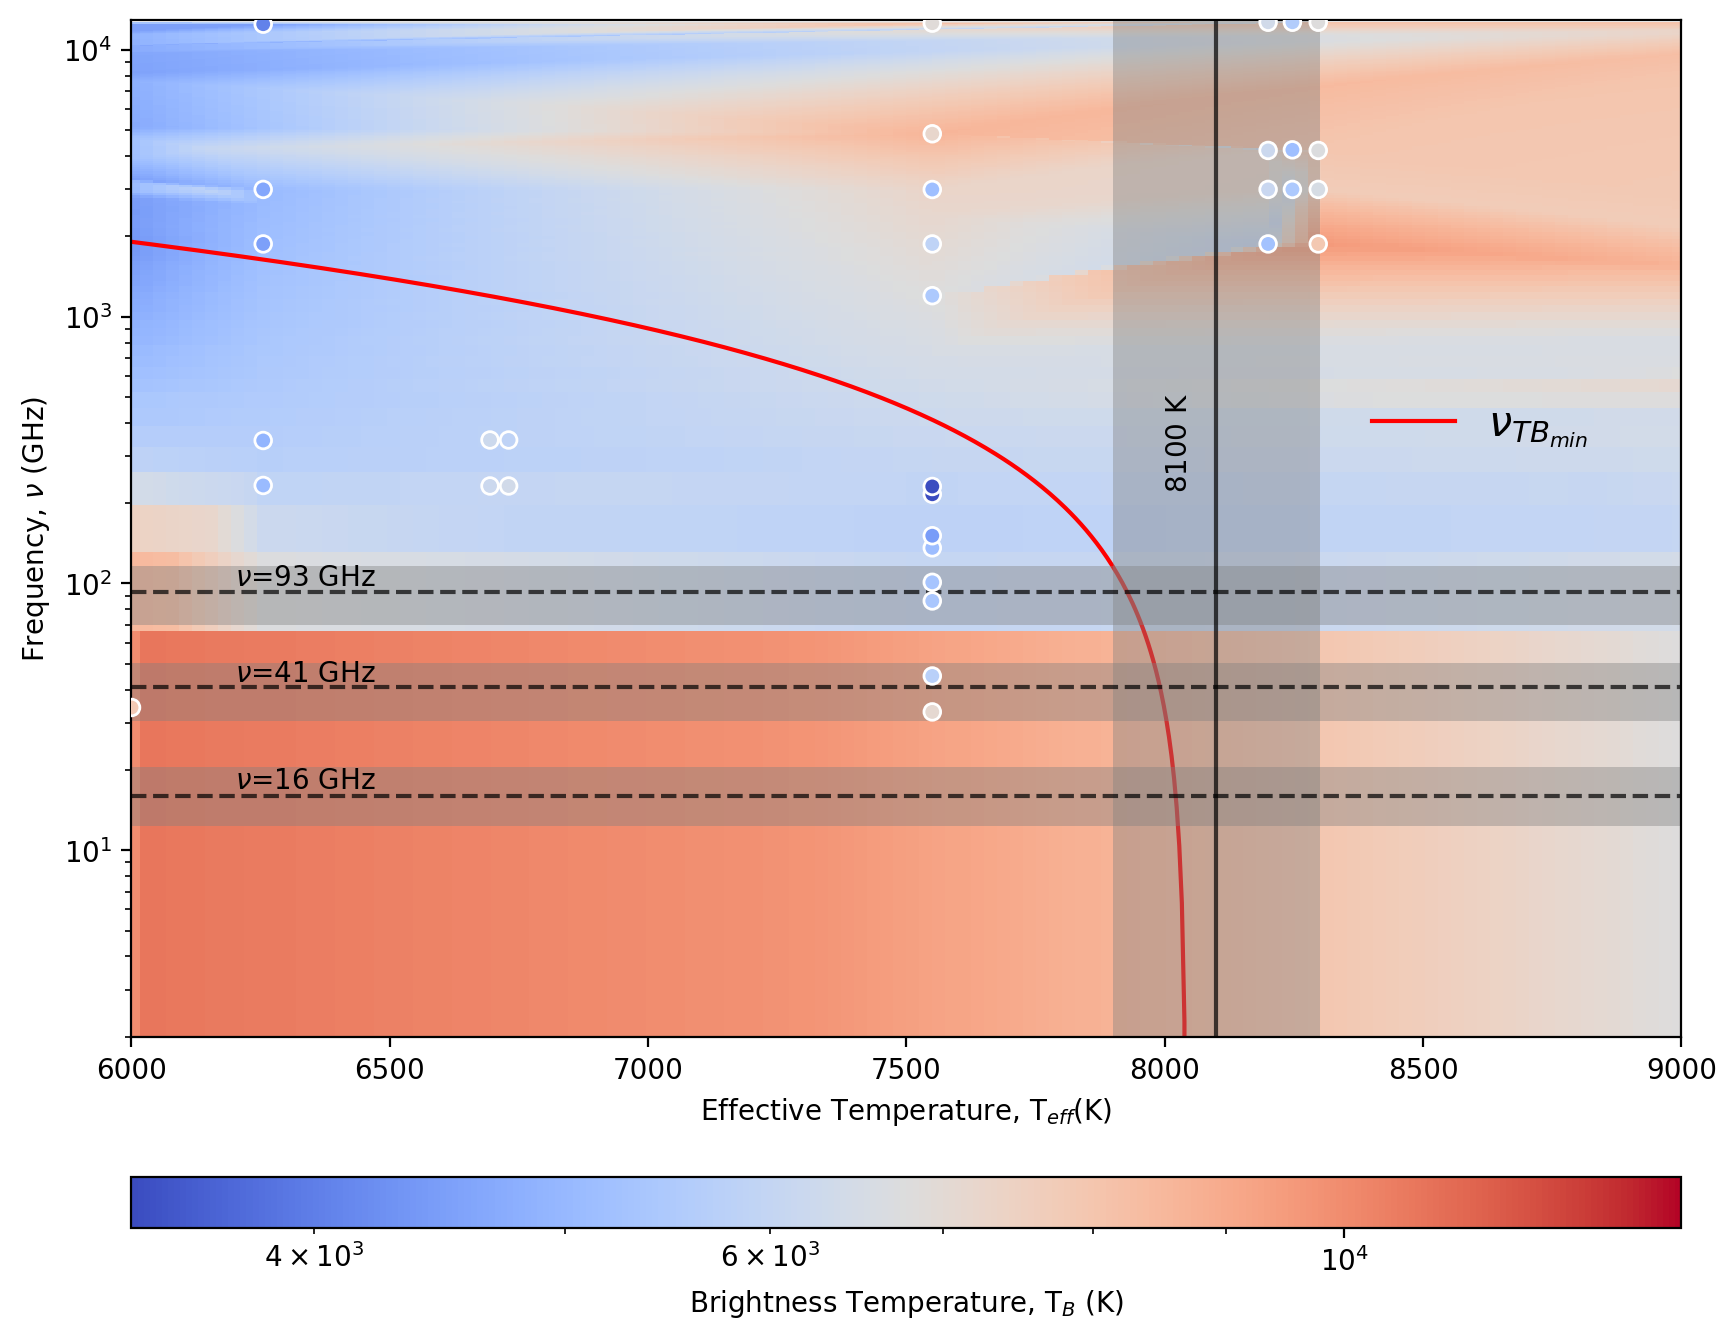
In our most recent work (Tapia-Vázquez et al. submitted) we have used observations at wavelengths ranging from the far infrared to the millimeter to build models of the temperature structure that have revealed the existence of temperature minima in stars with effective temperatures smaller or equal than 7,500 K. Those models allowed us to establish a relationship between the minimum temperature and the effective temperature of the star. We also established a relationship between the frequency at which the temperature minimum is observed and the effective temperature of the star. However, for stars with effective temperatures around 10,000 K, observations reveal that the temperature structure changes their morphology. White et al. (2020) 6 show that for Sirius A, there is no warming in the atmosphere; on the contrary, the temperature drops as we move away from the photosphere.
Remember that for stars with a mass greater than 1.5 ms the internal structure changes. The core becomes convective and the transport of energy towards the upper layers is carried out by radiative transfer. Not having a convective zone near the photosphere, this type of star lacks strong magnetic fields, so layers such as the chromosphere and the corona do not exist. Therefore, the existence of this layer has a direct impact on the dynamics and heating of the outer solar atmosphere. Nevertheless, the physical mechanism supporting the existence of this region remains unknown but can be related to internal structure.
How can the ngVLA help to understand this region?
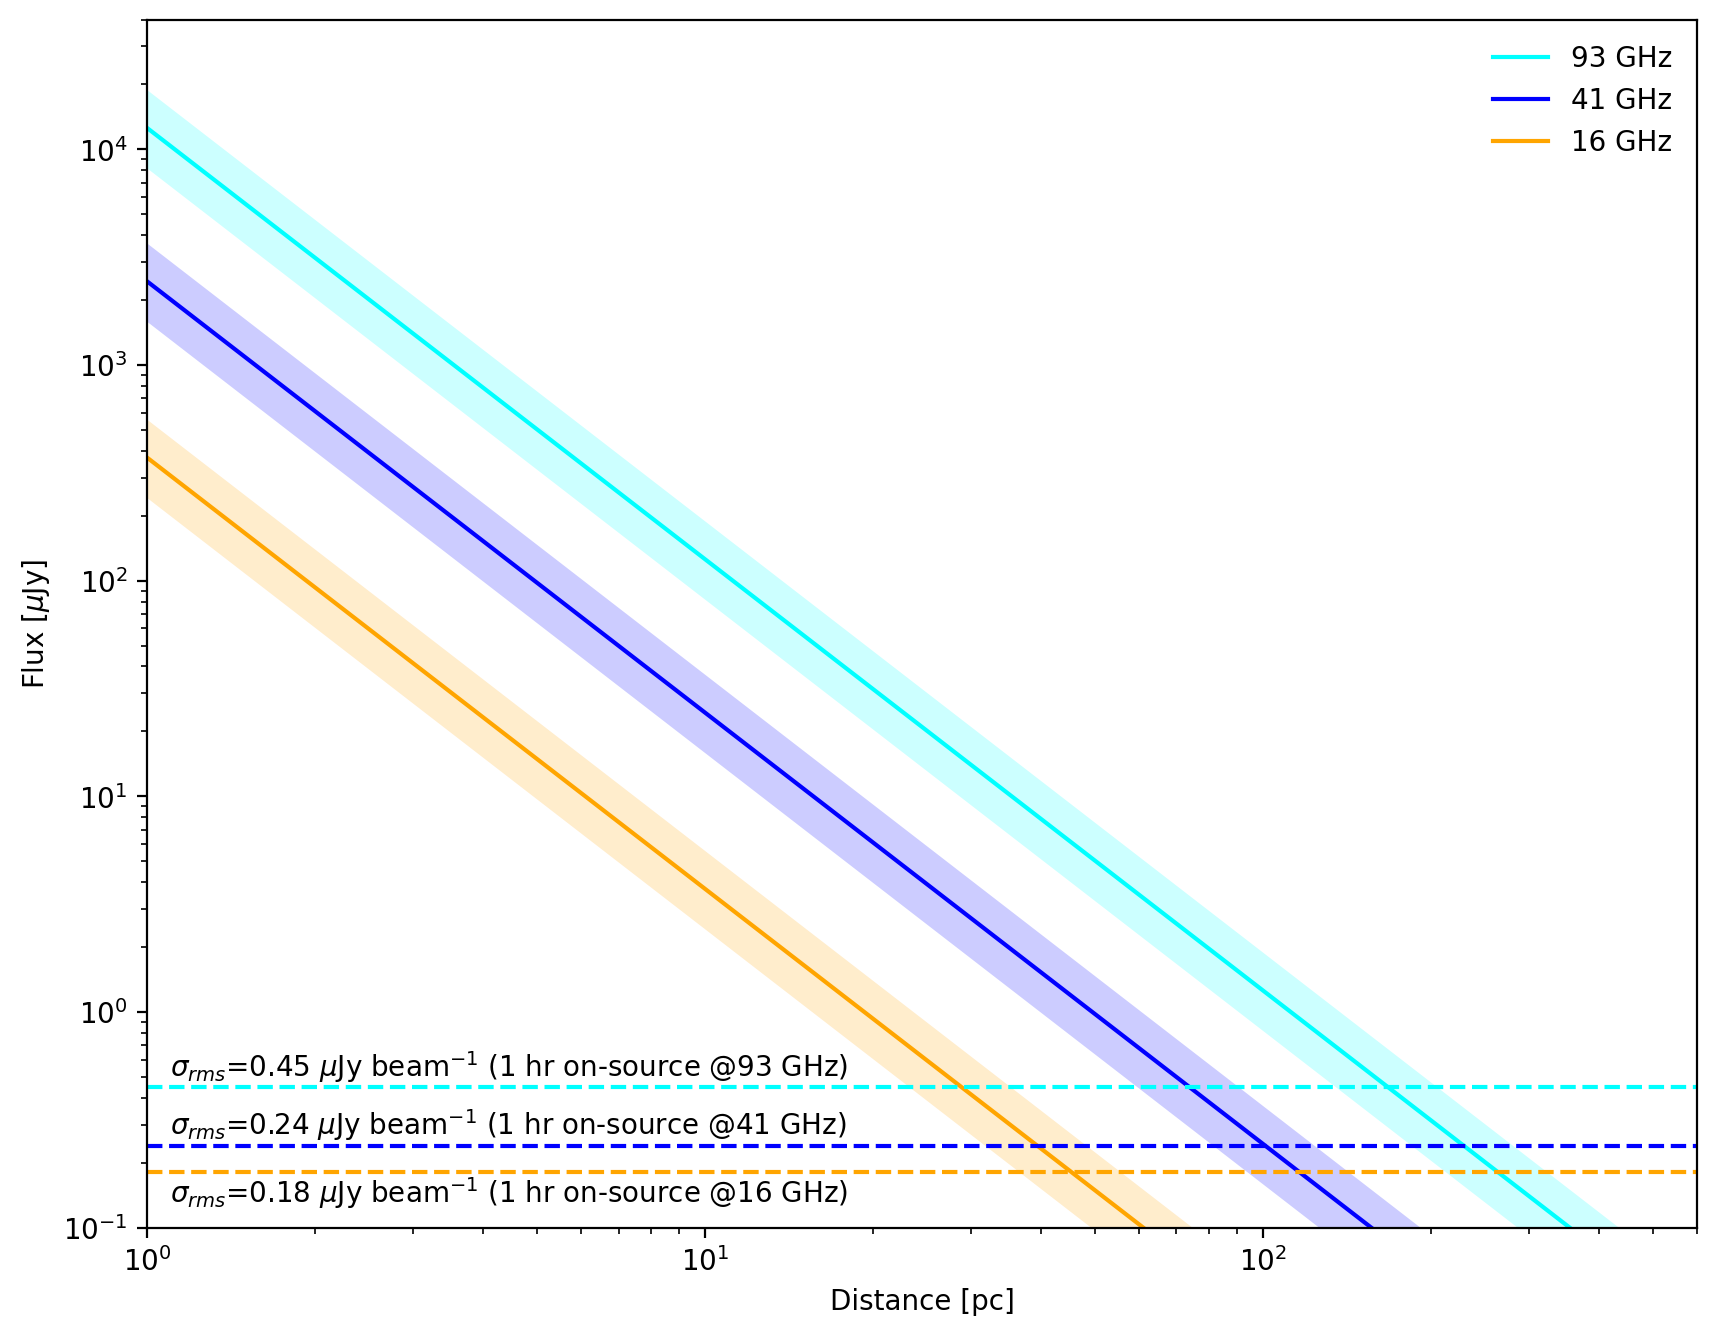
Günther et al.(2022)8 proposes that the internal structure changes when the effective temperature of the star is around 8,100 K. If the temperature minimum is related to the internal structure of the star, then we should be able to see the change in temperature structure around this effective temperature. Due to their unique capabilities, such as high sensitivity and high angular resolution, both ngVLA and SKA will enable us to census stars whose effective temperatures are between 7,500 K and 10,000 K. Combining these observations with other wavelengths obtained with facilities such as ALMA or the James Webb telescope, we will be able to understand what physical mechanism allows minimum temperature and what its relationship with the dynamics of the atmosphere is.
Acknowledgement
This work was supported by the Ciencia Básica (254497) CONACyT Fellowship. The author is grateful for the PAEP-UNAM fellowship.
References
Liseau, R., Montesinos, B., Olofsson, G., et al. 2013, A&A, 549, L7 Doi ↩︎
Liseau, R., Vlemmings, W., Bayo, A., et al. 2015, A&A, 573 Doi ↩︎
Liseau, R., De la Luz, V., O’Gorman, E., et al. 2016, A&A, 594, A109 Doi ↩︎
Tapia-Vázquez, F., & De la Luz, V. 2020, ApJS, 246, 5 Doi ↩︎
White, J. A., Tapia-Vázquez, F., Hughes, A. G., et al. 2020, ApJ, 894, 76 Doi ↩︎
White, J.~A., Tapia-V{'a}zquez, F., Hughes, A.~G., et al. 2021, APJL, 912, L5 Doi ↩︎
Günther, H.~M., Melis, C., Robrade, J., et al. 2022, AJ, 164, 8 Doi ↩︎
Francisco Tapia Vázquez
SysOps specialist | DevOps
My research interests include radioastronomy, stellar atmospheres and high performance computing.